Used-Car Prices Turned Up Again in October. Here's What Your Trade-In Is Worth Now
Wholesale used prices rose 2.2% year over year in early October while new-car cuts stayed narrow. Where the lease returns went, which segments hold value, and what the Fed adds.
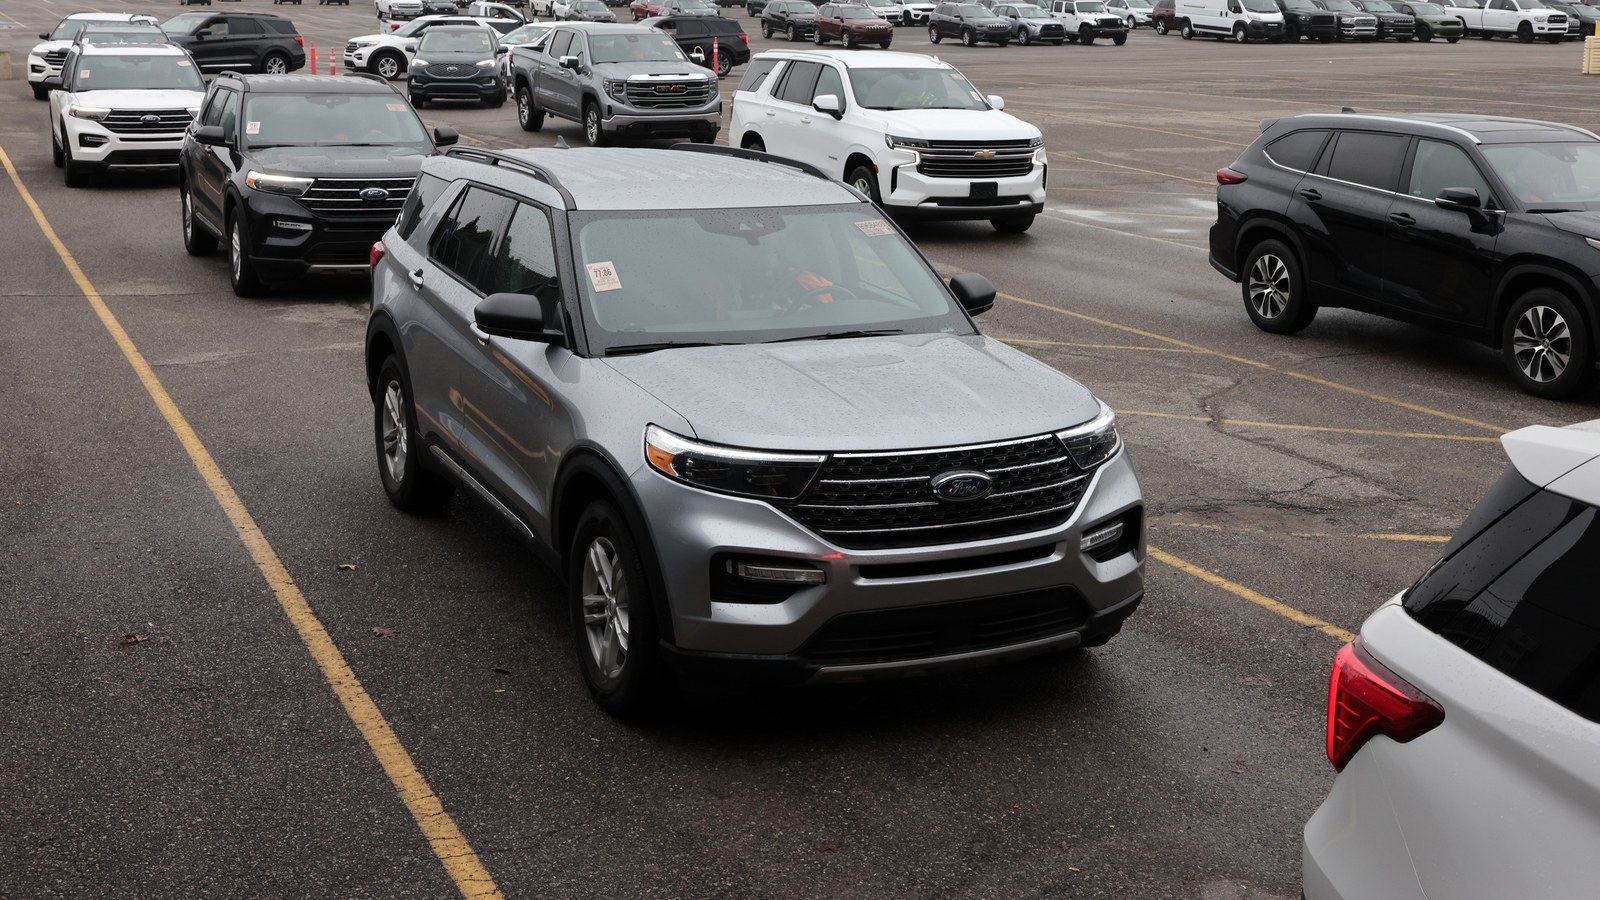
New-car prices are being trimmed in a few corners of the market. Used-car prices are not following them down. In the first half of October, wholesale values tracked by Cox Automotive's Manheim index rose 0.7% from September and sat 2.2% above a year ago, reversing the dip we covered when September's Manheim reading fell. That matters if you are about to hand a dealer the keys to a two- or three-year-old car, because the trade-in number on the paperwork starts at the auction, not at the showroom.
This piece pulls together what Cox has published this month, what the Fed and the gas pump do to the math, and where the data stops. The full October index does not land until November 6, so a half-month reading gets treated as one.
What the index says right now
The Manheim Used Vehicle Value Index stood at 207.4 through October 15, according to Cox Automotive's mid-month report. That is up 0.7% from September on an adjusted basis and up 2.2% year over year. Raw, unadjusted prices fell 2% from September, a touch more than the 1.5% October average over the long run; the adjusted index rose because the mix of vehicles crossing the block and their mileage shifted.
The reason is supply, not a rush of buyers. Wholesale days' supply slipped to 28.2 days on October 15 from 28.7 at the end of September, and the year-over-year gap narrowed from 2.5 days to about one. Jonathan Gregory, a senior director at Cox, put it in one line: supply, not demand, appears to have slowed depreciation.
September told a different story. The index fell 1.1% to 205.9, 0.6% below a year earlier, and third-quarter depreciation ran fast enough for Cox to cut its year-end forecast from a 2% gain to roughly 0.2%. Gregory's own caveat applies: October started on steadier ground, but the full month will decide whether it holds.
Which used cars are holding value, and which aren't
The averages hide a split that is wider than the headline. Here is how Cox's segments compared with a year earlier, with the full September figures from its third-quarter report alongside what it has published for the first half of October.
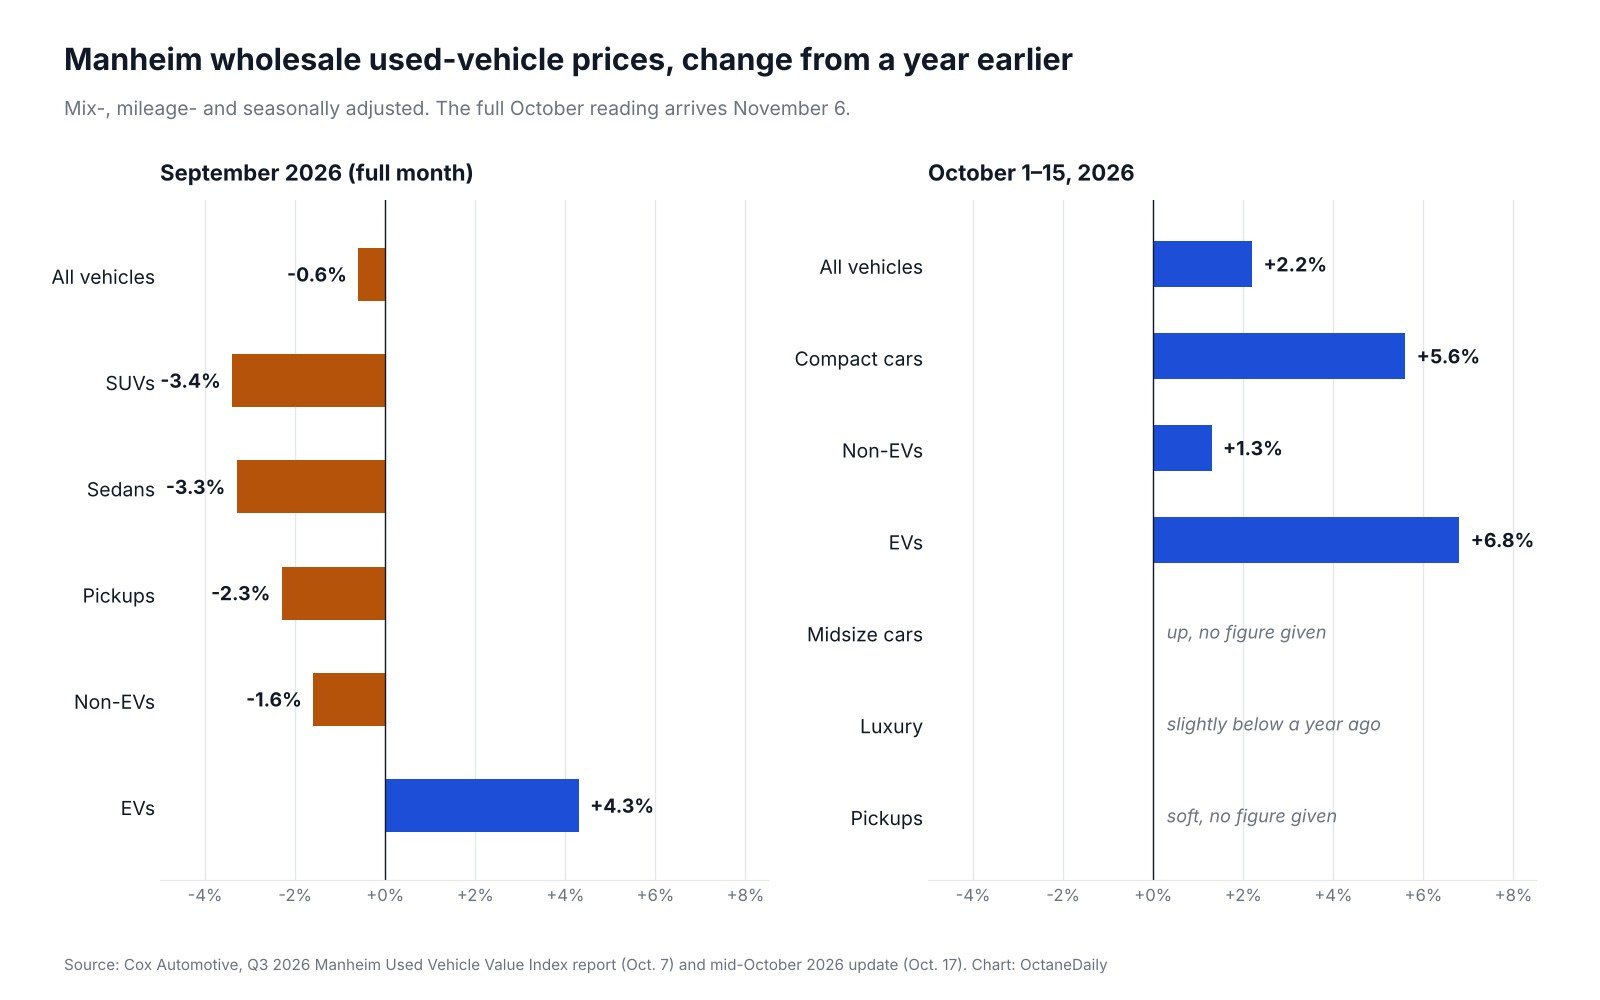
| Segment | September 2026 vs. a year earlier | October 1–15 vs. a year earlier |
|---|---|---|
| All vehicles | −0.6% | +2.2% |
| Compact cars | Up (no figure published) | +5.6% |
| Midsize cars | Down (no figure published) | Up (no figure published) |
| Sedans (all) | −3.3% | Not reported |
| SUVs | −3.4% | Not reported |
| Pickups | −2.3% | "Soft" (no figure published) |
| Luxury | Not reported | Slightly below a year ago |
| EVs | +4.3% | +6.8% |
| Everything but EVs | −1.6% | +1.3% |
Three patterns stand out. Compact cars are the strongest conventional segment, and Cox ties that directly to fuel prices. Regular gasoline averaged $4.29 a gallon on October 26 by AAA's count, against roughly $3.10 a year ago, and the hybrid numbers in Cox's quarterly call back up the link: wholesale hybrid sales were up nearly 25% in the third quarter on about 25 days of supply, the tightest of any fuel type. Three-year-old hybrids were retaining about 64.6% of their original sticker, against 57.8% for gas-only vehicles and 54.4% for EVs.
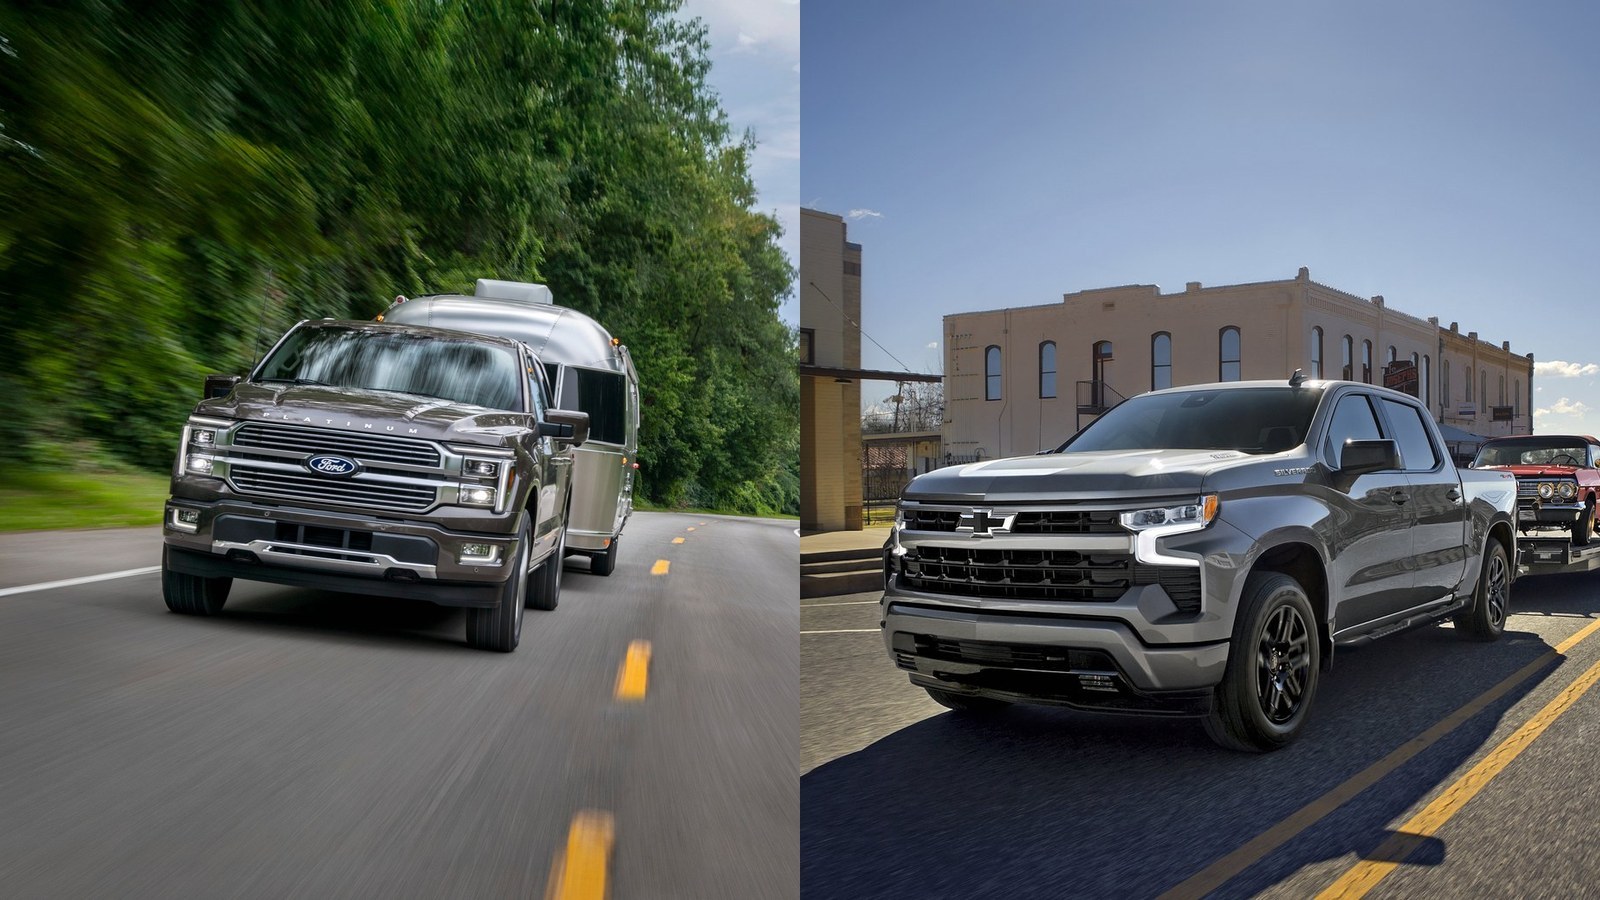
At the other end sit the vehicles that drink the most. SUVs as a group were down 3.4% in September, pickups 2.3%, and diesel supply at auction had ballooned to about 39 days, 28% more than a year earlier, with diesel sales down about 13%. If your trade-in is a large SUV or a diesel truck, the market is not waiting for you.
The third pattern is the one that keeps surprising people: used EVs are the only segment up by a meaningful margin in both periods. Cox's EV Market Monitor for September counted 47,862 used EV sales, 21.2% more than a year earlier, at an average listing price of $36,767, up 6.4%. Days' supply fell to 35. That is a function of scarcity rather than a verdict on the cars, and the scarcity has an end date: EVs were about 10% of off-lease supply in the first half of this year, are expected to reach roughly 16% in the second half, and about 19% by next summer. Our used EV buying guide works through what that wave means if you are on the buying side.
Why there are so few used cars to begin with
The shortage is a 2022 problem showing up in 2026. Leasing collapsed when new cars were scarce and incentives vanished, so the three-year-old cars that would normally be returning to dealers this year were never leased. Cox's lease check-in index sits at 45 for 2026, with 2019 set at 100: lease returns are still 55% below pre-pandemic levels even after a 21% rebound from 2025.
The flow is rising, just slowly: from about 190,000 vehicles a month in the first half of this year to about 220,000 in the second, with growth continuing through the summer of 2027. For 2026 as a whole, off-lease supply is up almost 23%, which sounds like a lot until you remember the base.
The second squeeze is at the bottom of the market. Dealers held 2.21 million used vehicles at the end of September, 49 days of supply, but cars under $15,000 were down 16.2% from a year earlier and made up 15.7% of listings, against 19.4% a year ago. That is why the average used listing price hit $27,235 in September, the highest since December 2022, even as the wholesale index slipped.
What "new cars are cheaper" actually means
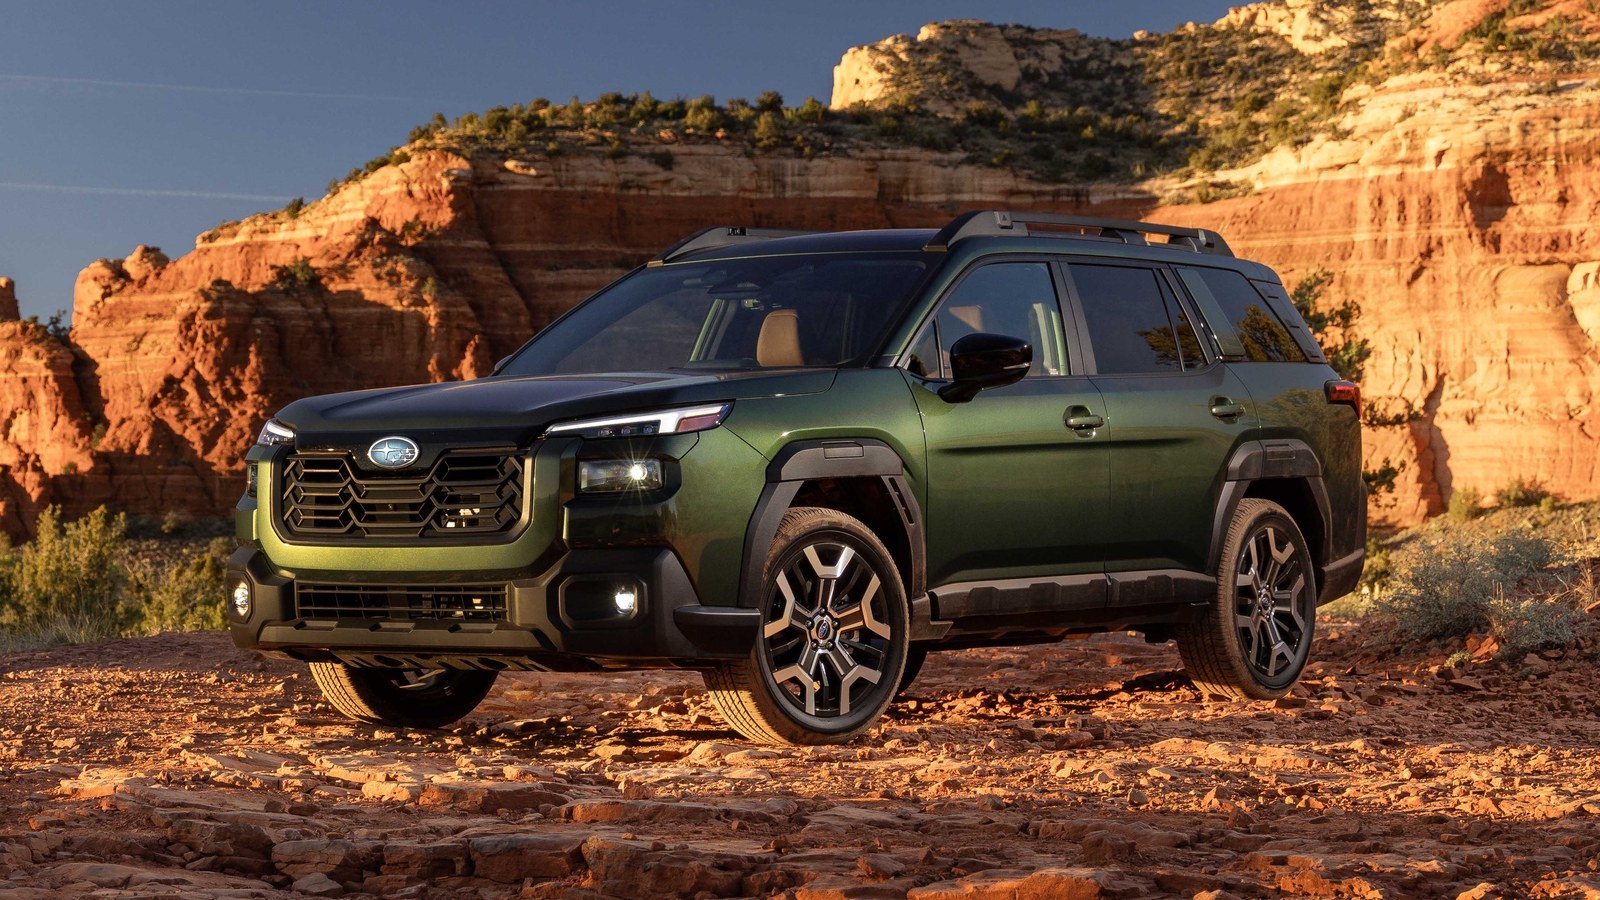
Here is where I'd push back on the framing you'll hear on dealer lots. Yes, Subaru cut the 2027 Outback by $2,000 and Ford repriced the Mach-E, and we laid out who is cutting new-car prices and why. But the average new vehicle still sold for $50,562 in September, up 0.7% from a year earlier, with incentives at 6.6% of the price, down from 7.3%. The cuts are surgical, aimed at models that are not selling.
What has changed is inventory. New-vehicle days' supply sat at 82 for the market at the end of September and at 101 for Ford, by Cox's count, which is the number we used in our third-quarter earnings scorecard. Used retail supply was 49 days. Dealers have more new cars than they want and fewer used cars than they want, and that imbalance explains most of what you will see in a trade-in appraisal.
For a two- or three-year-old car, the arithmetic looks like this. Cox puts the average one-year-old vehicle at about $33,000 at resale, down roughly 4.5% from a year ago, and the average three-year-old at about $26,800, down 3.7%. Three-year-old vehicles at auction have averaged about $25,600 so far this year, more than 7% below 2025. So values are down from last year, but by low single digits, against a new-car market that has not come down at all. The gap between what you are trading and what you are buying has not closed from the top.
One number in the Cox call deserves more attention than it got: lease-weighted equity was about negative $1,700 in September, the lowest reading on Cox's chart. If a 2023 lease is ending, the car is more likely worth less than its buyout than more. Check before assuming there is equity to roll into the next deal.
Rates and fuel are moving the other way
Two forces are working against used-car buyers even as prices firm. The Federal Reserve raised its target rate by a quarter point in September, to 3.75% to 4%, the first increase since 2023, and its September minutes show most participants expected another increase by year-end. The committee meets again on October 28, and futures markets lean toward no change this time. Cox's Mark Strand said in the quarterly call that auto loan rates will likely follow if the 10-year Treasury stays above 5%, where it was in late September.
Used-car loans already averaged 10.6% in the third quarter, at $582 a month, by Edmunds' count. We ran the long-loan math in our look at 84-month car loans, and the conclusion holds for used cars with more force: the longer the loan on a car that has already done its steepest depreciation, the longer you are underwater.
Five things to take from the data
- Q4 is the weak season, not a cliff. Cox's Jeremy Robb called it the weakest season for wholesale values, and Gregory said October's firmness needs a full month to confirm. The data argues against rushing a sale into November on the assumption that January will be worse. It does not say January will be better, and I won't pretend it does.
- Compact cars and hybrids are holding value; so, for now, are EVs. If that is what you are trading, you are selling into a thin market. If that is what you are buying, you are paying for the scarcity.
- Large SUVs, pickups, and anything diesel are losing ground. Diesel supply at auction is up 28% in a year. Appraisals on these will reflect it.
- "New cars are cheaper" does not mean your used car is worth less. New-car cuts are confined to a handful of slow sellers; the average transaction is still up. Three-year-old values are down about 4% year over year, not 10%.
- The cost of carrying a used car is rising faster than its price. At a 10.6% average rate, with a Fed leaning toward more increases, the loan, not the sticker, is where the money goes.
What we don't know yet
The full October Manheim index, with a complete segment breakdown, arrives on November 6, and it will say whether the mid-month steadiness survived the second half of the month. Cox has not published October figures for SUVs, pickups, or sedans, which is why the table above has gaps rather than estimates. Dealer trade-in data, the actual numbers appraisers are writing on the paperwork, is not public, so everything here describes the wholesale market that feeds those appraisals, not the appraisals themselves. And the Fed's decision on October 28, followed by its December meeting, will set the borrowing cost for anything you buy with the trade-in money.