Waymo's 82% Fewer Injury Crashes: What the Robotaxi Safety Number Actually Measures
The percentages count every crash regardless of fault, against a modeled human benchmark — and an independent IIHS check landed within a point of Waymo's own injury figure.
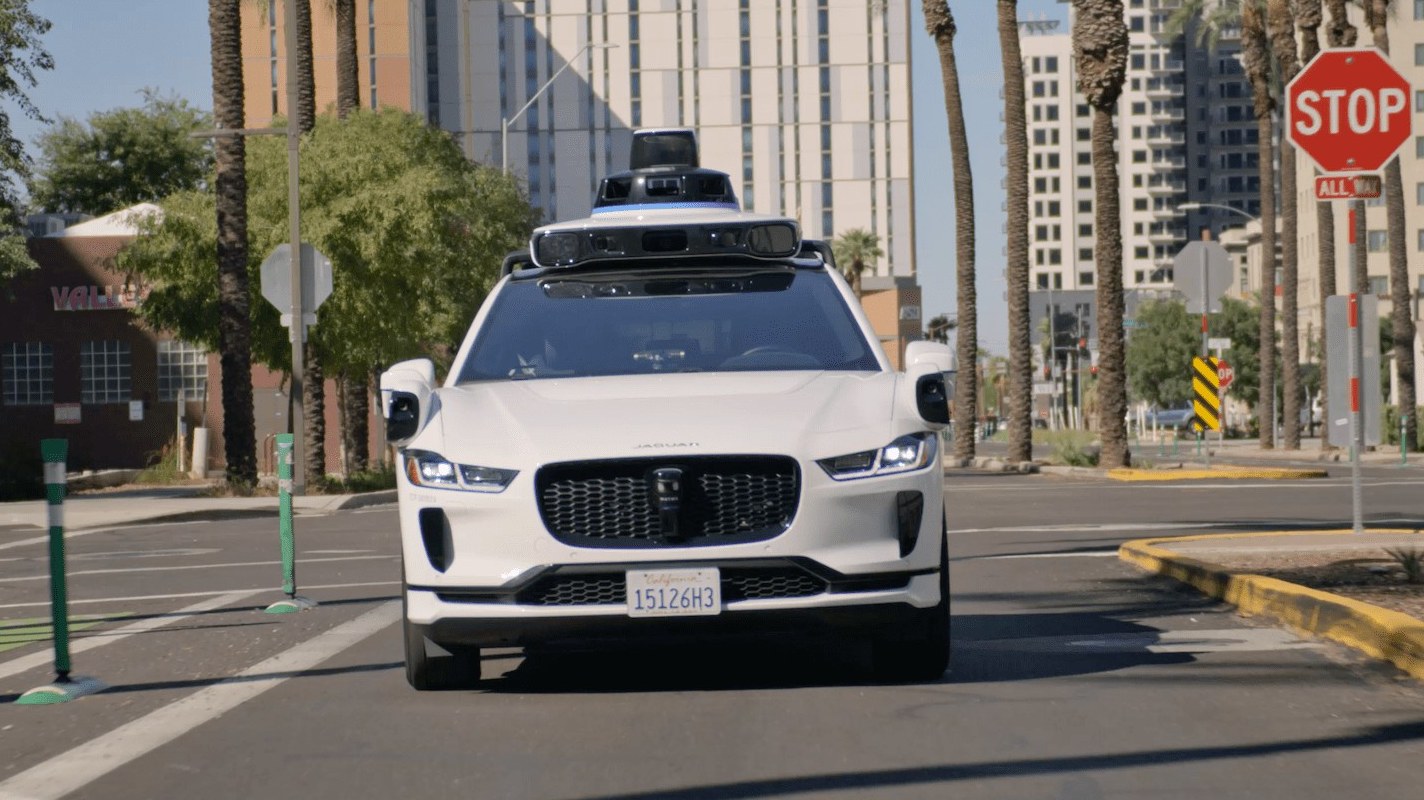
Waymo's driverless fleet has now covered more than 270 million miles with no one behind the wheel, and the company's latest safety tally says those miles produced 82% fewer injury-causing crashes than human drivers would have logged on the same roads. The update, published September 24, covers operations through the end of June 2026 in Atlanta, Austin, Los Angeles, Phoenix, and San Francisco.
The headline numbers: 841 fewer crashes with any reported injury, 55 fewer crashes with serious or fatal injuries (a 95% reduction, or roughly 20 times fewer), and 358 fewer crashes in which an airbag deployed in any vehicle involved. For the road users with the least protection, Waymo reports 93% fewer injury crashes involving pedestrians, 86% fewer involving cyclists, and 82% fewer involving motorcyclists.
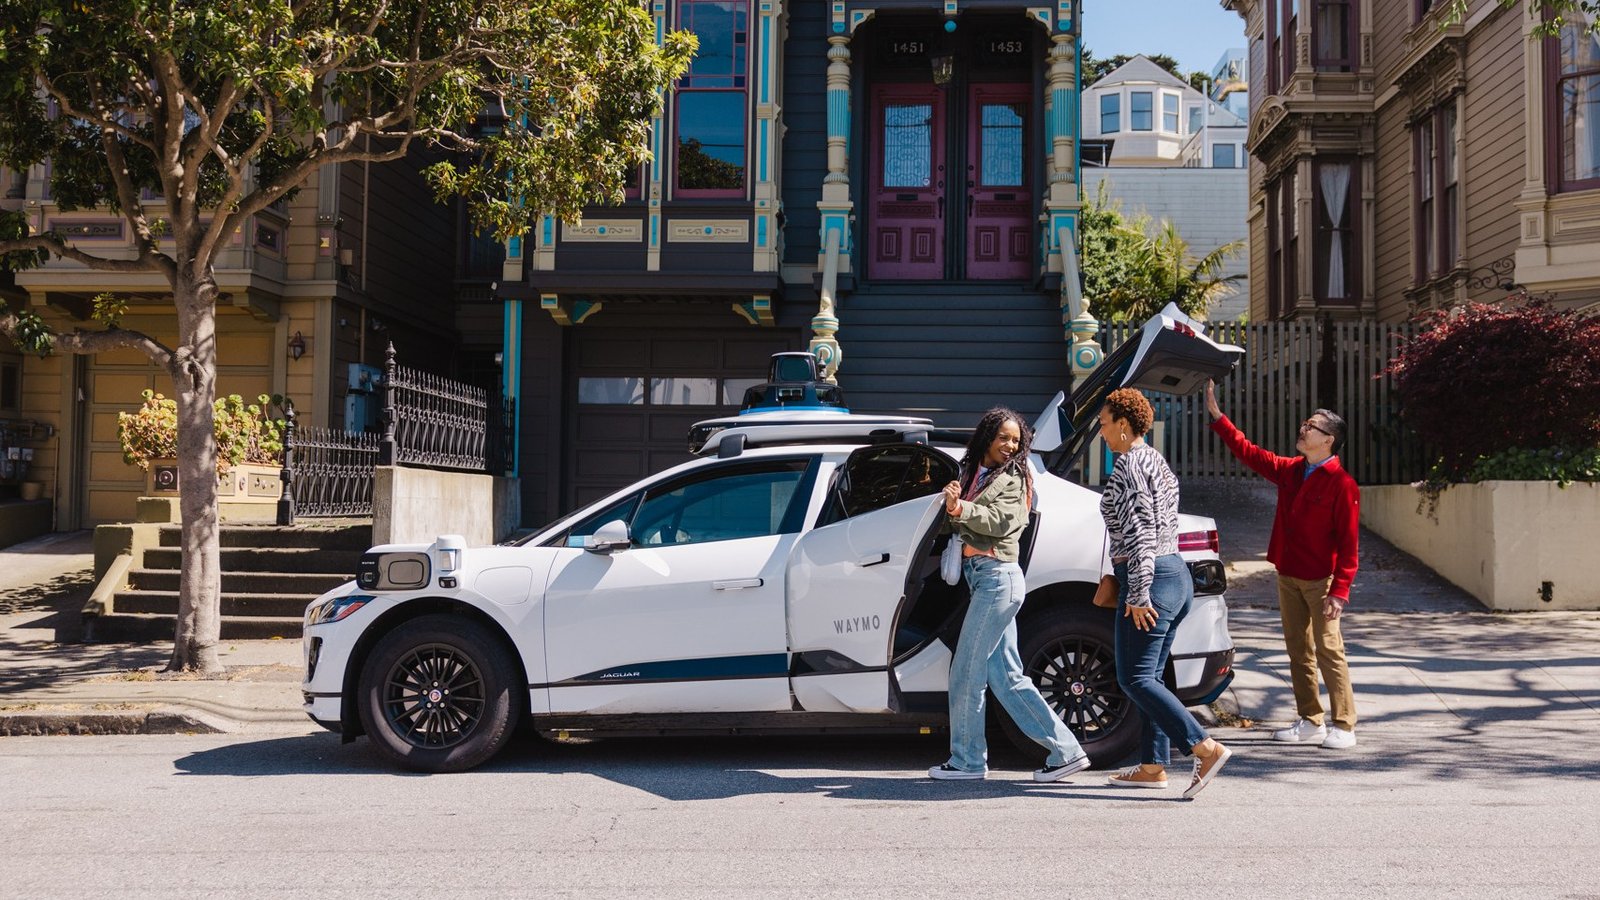
What "82% fewer" actually measures
The percentages are not a measure of fault. Waymo counts every crash its vehicles were involved in, regardless of who caused it, and compares that rate per million miles with a modeled human benchmark for the same cities. A robotaxi rear-ended at a red light counts against Waymo exactly as it would against a human driver.
The benchmark is the more debatable half of the equation. Waymo builds it from state police crash records and vehicle-miles-traveled data, limited to passenger cars on the kinds of surface streets its cars use (freeways are excluded), then reweights it to match where its fleet actually drives. Because humans don't report every fender bender, the any-injury benchmark also gets a 32% upward adjustment for unreported crashes, based on a 2023 NHTSA estimate. The serious-injury and airbag benchmarks get no such adjustment, which Waymo says likely understates its advantage there.
The "841 people" framing goes one step further: it assumes at least one injured person per avoided crash, a floor rather than a count. And the absolute numbers behind the rates are small. At Waymo's published rate of 0.67 injury crashes per million miles, the fleet was involved in roughly 180 injury crashes over 271 million miles, against about 1,020 expected for humans. For serious-or-worse crashes, the comparison works out to roughly three versus 58.
The city-level breakdown shows the reduction tracks how dangerous the human baseline is. In San Francisco, the human benchmark for injury crashes is 6.64 per million miles and Waymo's rate is 0.67, a 90% gap. In Phoenix, with its wide, slow suburban grid, the benchmark is 1.95 and Waymo sits at 0.56, a 71% reduction. Los Angeles lands at 66%.
The split by crash type is where the technology's strengths and limits show. Injury crashes at intersections are down 96% and single-vehicle crashes 97%, but front-to-rear collisions fall only 48%, the category in which the robotaxi is most often the vehicle being hit.
The independent check
Waymo is still the only robotaxi operator that publishes its mileage alongside crash reports, and outside researchers have begun to test its math. In July, the Insurance Institute for Highway Safety ran its own comparison using police-reportable crashes in four cities from 2021 through 2024 and found Waymo's rate 68% below human drivers overall and 81% lower for injury crashes, close to Waymo's own 82%. IIHS also flagged the caveats: the overall gap was just 35% in San Francisco, the Austin sample was too small to mean anything, and about a quarter of Waymo's NHTSA filings had to be discarded as duplicates or off-road contacts before the numbers were usable. The institute's verdict was that today's reporting system isn't built to monitor a large-scale rollout.
Compared with Waymo's previous update in June, which covered 220 million miles through March, the serious-crash reduction ticked up from 94% to 95% and the cyclist figure from 84% to 86%, while the motorcyclist number slipped from 84% to 82%. Over one quarter and roughly 50 million miles, the count of avoided injury crashes rose by 134.
Waymo hasn't said how many of its crashes it considers its own fault, and no regulator has audited the benchmark methodology. The full dataset, including the NHTSA report IDs behind each category, is on the company's Safety Impact hub. If the quarterly cadence holds, the next slice will cover miles through September. For how these numbers fit into the robotaxi race, see our Cybercab vs. Waymo comparison.