The Average New Car Now Costs $51,109. Four of the Five Biggest Segments Cost Less
Kelley Blue Book's October average set a record, but stickers rose slower than normal and discounts stayed thin. The bigger push came from what people bought.
The average new vehicle sold in the U.S. last month went for $51,109, the highest figure Kelley Blue Book has ever recorded. That is $649, or 1.3%, more than in September, and 2.1% more than in October 2025, according to the Cox Automotive report published Nov. 10.
A record sounds like a verdict on affordability. Cox's own analysts read it differently. Erin Keating, the company's executive analyst, says the October average tells us "as much about product mix as it is about affordability." The data backs her up: sticker prices rose more slowly than usual, discounts barely moved, and four of the five best-selling segments sold for less than the average. Our scorecard of 2027 model-year price increases found the same thing from the other direction: most stickers are creeping, not jumping.
So what pushed the average to a new high? Take the number apart and three pieces fall out. Only one of them is a story about cars getting more expensive.
Piece one: prices are rising, but slower than normal
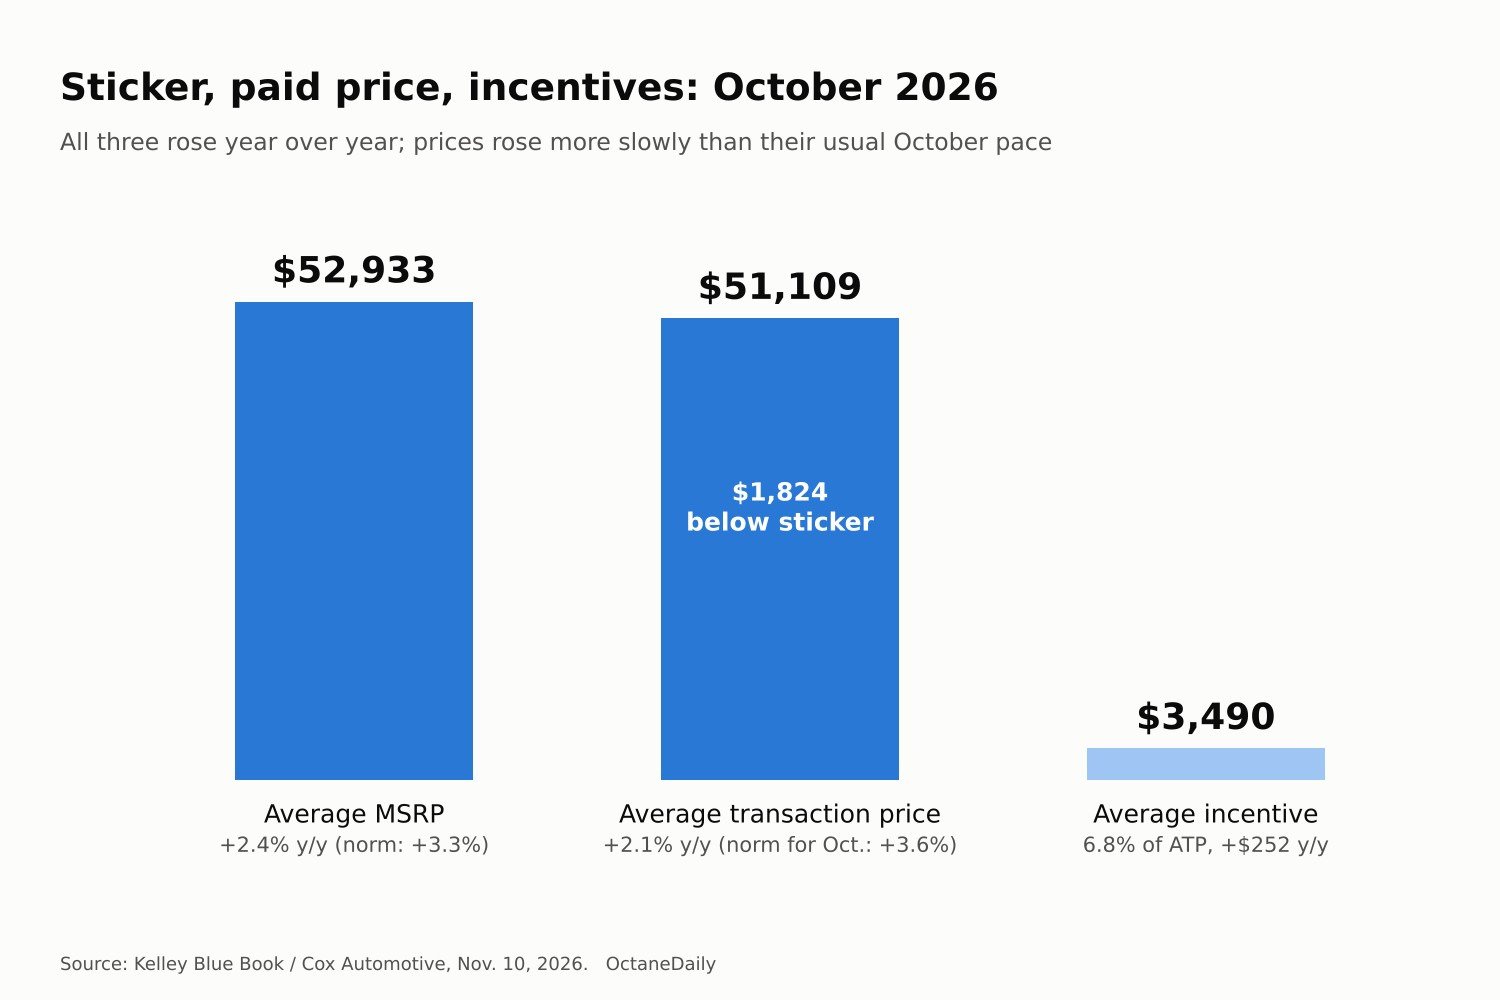
Start with the stickers. The average MSRP reached $52,933 in October, up 1.4% from September and 2.4% from a year earlier. Cox says the industry typically sees a 3.3% annual increase in MSRP, so this year's gain is below the usual pace.
The transaction price tells the same story. A 2.1% year-over-year gain sounds like a lot until you set it against the norm: Cox puts the long-run average increase for October at 3.6%. By that measure, October 2026 was a mild month for price inflation, not a hot one.
It also helps to know what the $51,109 includes. Kelley Blue Book's transaction price is what buyers paid for the vehicle before consumer incentives, taxes, and fees are applied. On average, they paid $1,824 less than the sticker, about 3.4% below MSRP.
Piece two: incentives are up a little, but still thin
Automakers spent an average of $3,490 per vehicle on incentives in October, equal to 6.8% of the transaction price. That is about $130 more than in September and $252 more than a year ago, so discounts are growing slightly.
Cox's point is that they remain below long-term averages, which suggests automakers and dealers aren't pushing hard to clear inventory, even at record prices. When incentives are this lean, the transaction price tracks the sticker more closely, and any shift toward pricier vehicles shows up in the average almost one for one.
That matches what we saw when we looked at who is cutting 2027 prices and why: cuts are targeted at models losing sales, not spread across the market.
Piece three: the mix is doing the heavy lifting this month
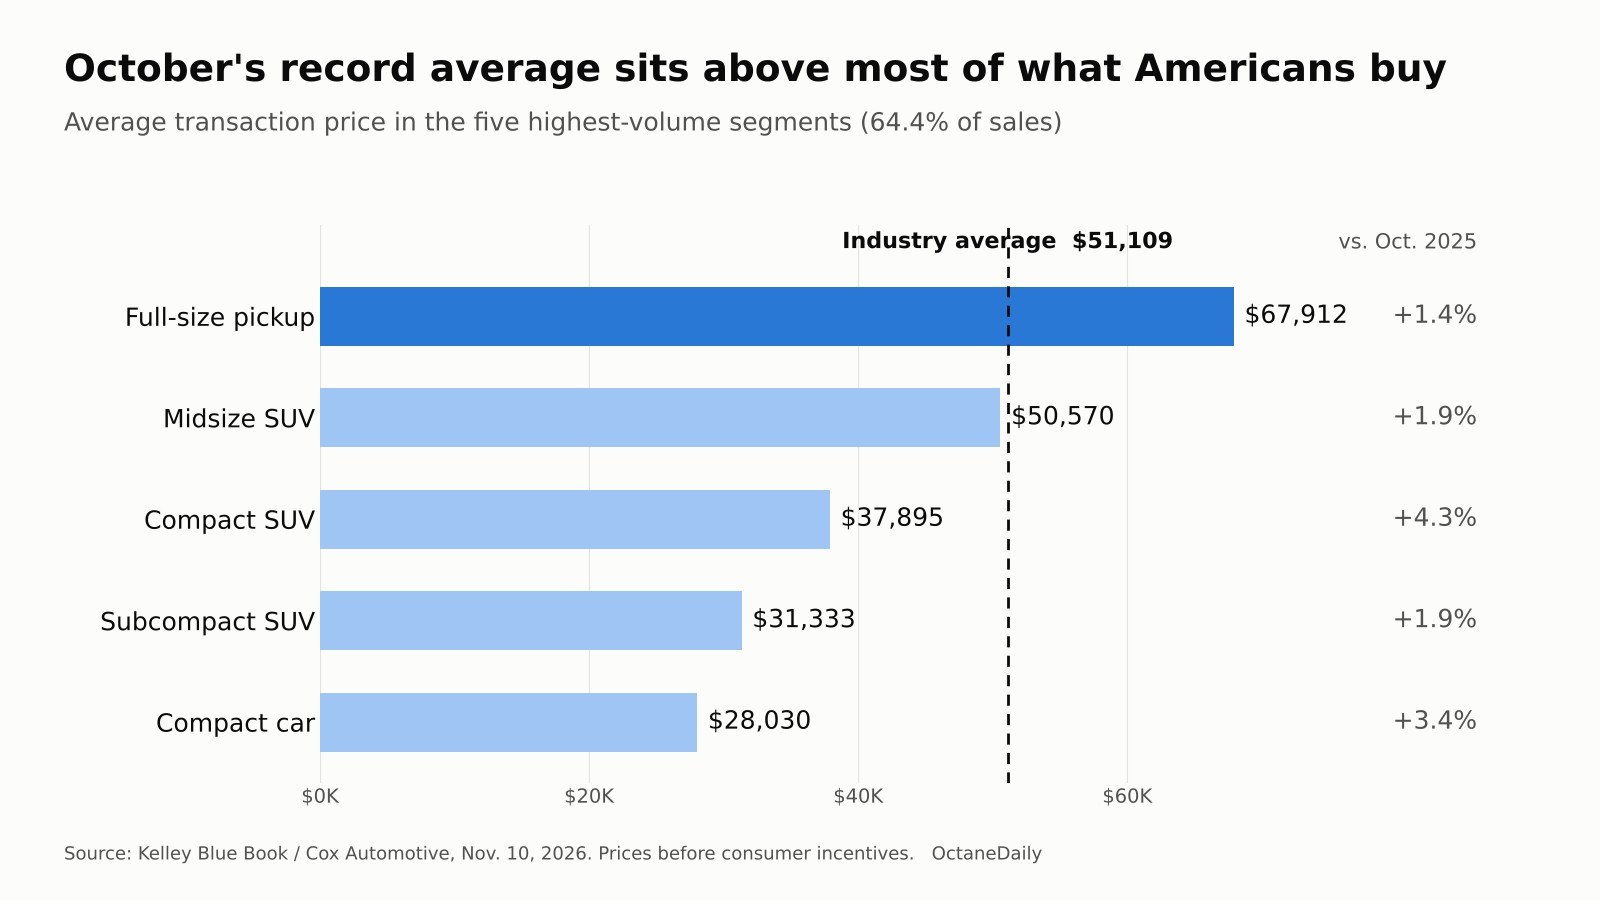
Here is the part the headline hides. Look at the five highest-volume segments, which together accounted for 64.4% of October sales. Kelley Blue Book's data tables show how much each one moved from September:
| Segment | October ATP | vs. September | vs. October 2025 | vs. $51,109 average |
|---|---|---|---|---|
| Full-size pickup | $67,912 | +0.5% | +1.4% | +$16,803 |
| Midsize SUV | $50,570 | -0.1% | +1.9% | -$539 |
| Compact SUV | $37,895 | +0.7% | +4.3% | -$13,214 |
| Subcompact SUV | $31,333 | +0.4% | +1.9% | -$19,776 |
| Compact car | $28,030 | +0.2% | +3.4% | -$23,079 |
| Industry average | $51,109 | +1.3% | +2.1% | — |
None of the five big segments rose more than 0.7% from September, and the midsize SUV average actually dipped. Yet the industry average climbed 1.3%. When the parts move less than the whole, the difference comes from which parts people bought more of. Cox attributes October's gain in part to strong sales of expensive midsize and full-size SUVs and full-size pickups, and says midsize SUVs overtook compact SUVs as the top-selling segment, with volume up nearly 10% from a year ago.
Midsize SUVs at about $50,500 replacing compact SUVs at about $37,900 as the volume leader is, by itself, enough to drag an average upward without a single sticker changing. Add full-size SUVs, whose average rose 1.6% in a month to $80,957, and full-size pickups at nearly $68,000, and to me the record starts to look like a calendar effect: big, well-equipped trucks and SUVs had a strong October.
The year-over-year view says something different
Zoom out to twelve months and the mix argument flips. Compact SUVs are up 4.3% and compact cars 3.4% from a year ago, both well ahead of the industry's 2.1%. Over the year, the affordable end of the market got more expensive faster than the average did.
That fits Keating's other finding: vehicles priced from roughly $28,000 to $38,000 gained 9.6% in combined volume year over year. More buyers moved into that band, which holds the annual average down even as prices inside the band rise faster. In my view, this is the number buyers should watch more closely than the record. The Chevrolet Trax is a good example: dropping the base trim made the cheapest 2027 Trax $2,000 dearer, and our look at what's still under $25,000 found only two crossovers left in that bracket.
Who is pushing the average up
The brand tables point the same way. Ford Motor Company's average transaction price rose 6.5% year over year to $62,326, and Stellantis' rose 9.2% to $59,947, with Ram at $69,850 and Jeep at $53,592. Both groups sell heavily in pickups and larger SUVs. Lincoln was up 11.3% to $78,132, and Cadillac jumped 6.4% in a single month to $90,101.
Those last two line up with what we found in the scorecard: the 2027 Lincoln Corsair dropped its front-drive and plug-in versions, and the base Escalade trim disappeared from Cadillac's configurator. Cox doesn't break down brand averages by cause, so treat that as a likely contributor, not a proven one. But it is a reminder that deleting entry trims raises the average price paid without raising any one price.
Not every big name moved up. General Motors' average was down 1.0% from a year earlier at $55,886, and Mercedes-Benz fell 8.0% to $71,086. Honda barely moved, up 0.6% at the group level.
EVs and the Cybertruck: mix at the brand level
Electric vehicles sold for an average of $56,220 in October, up 1% from September but 2.7% lower than a year ago. EV incentives averaged 11.3% of the transaction price, well above the 6.8% industry figure.
Tesla's average was $54,194, slightly down from September but 1.2% higher than a year earlier. Cox names the Cybertruck as one reason. By its estimate, Tesla sold 1,914 Cybertrucks in October, the strongest month in more than a year, at an average of $92,380. That is roughly what mix looks like inside a single brand: a small number of very expensive trucks is enough to lift the average for the whole lineup.
The strong month came just before the truck's outlook changed. In early November, Elon Musk said Tesla would wind down Cybertruck production around mid-2027, and he has since said Tesla will refund many Cybertruck deposits before the line shuts. None of that is in the October numbers.
What the record means if you're shopping
The $51,109 figure is real, but it is an average across a market where four of the five best-selling segments sit below it. If you are shopping for a compact SUV, the relevant number is closer to $38,000, and it has risen faster than the headline over the past year. If you are shopping for a full-size pickup, you are part of the reason the headline is so high.
The purchase price is also only the first bill. AAA's 2026 study puts the average annual cost of owning a new vehicle at $12,863, with depreciation the biggest line, and our breakdown of AAA's ownership costs shows which of those costs a buyer can actually control. A higher transaction price feeds straight into two of them: depreciation and finance charges.
One more caution. Cox revised September's average down to $50,460 when it published October's figure, and monthly estimates can move again. The direction is clear. The precise size of a one-month jump is less certain than a single record number suggests.